class: right, middle, my-title, title-slide # State of the Ecosystem: ## Improving Synthesis<br /> and Management Applications ### Sarah Gaichas, Geret DePiper <br /> Northeast Fisheries Science Center --- class: top, left # Today's discussion: ## Improving State of the Ecosystem (SOE) report utility for SSC decisions .pull-left[ - Ecosystem synthesis approaches + General themes + Concrete worked example analysis - Response memo review - SSC discussion and feedback + Decisions where SOE report could help + Synthesis themes and management connections + Suggestions for 2021+ ] .pull-right[ *The IEA Loop<sup>1</sup>* 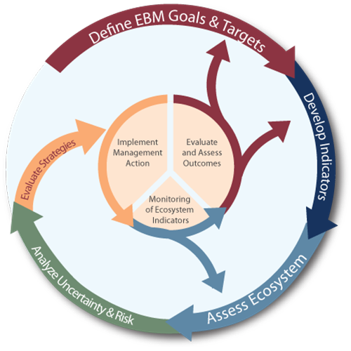 ] .footnote[ [1] https://www.integratedecosystemassessment.noaa.gov/national/IEA-approach ] ??? --- background-image: url("EDAB_images/Framework.png") background-size: 540px background-position: right ## Mid-Atlantic Council Ecosystem Approach .pull-left-60[ 2016 EAFM Policy Guidance document; revised 2019<sup>1</sup> 2016 MAFMC EAFM framework<sup>2</sup> 2017 Inital EAFM risk assessment completed; revised and published 2018<sup>3</sup> 2018 Council selected summer flounder as high risk fishery 2019 EAFM conceptual model linking summer flounder drivers and risks 2020 Council starting EAFM MSE for summer flounder recreational discards SOE indicators to be used for annual risk assessment updates But can the SSC get more from the SOE and risk assessment? ] .pull-right-40[ .footnote[ [1] http://www.mafmc.org/s/EAFM-Doc-Revised-2019-02-08.pdf [2] https://www.frontiersin.org/articles/10.3389/fmars.2016.00105/full [3] https://www.frontiersin.org/articles/10.3389/fmars.2018.00442/full ] ] ??? The Council’s EAFM framework has similarities to the IEA loop on slide 2. It uses risk assessment as a first step to prioritize combinations of managed species, fleets, and ecosystem interactions for consideration. Second, a conceptual model is developed identifying key environmental, ecological, social, economic, and management linkages for a high-priority fishery. Third, quantitative modeling addressing Council-specified questions and based on interactions identified in the conceptual model is applied to evaluate alternative management strategies that best balance management objectives. As strategies are implemented, outcomes are monitored and the process is adjusted, and/or another priority identified in risk assessment can be addressed. --- background-image: url("EDAB_images/nes-components-abstracted.png") background-size: 700px background-position: right bottom ## State of the Ecosystem (SOE) Reporting: Context for busy people *"So what?" --John Boreman, September 2016* 1. Clear linkage of ecosystem indicators with management objectives 1. Synthesis across indicators for big picture 1. Objectives related to human-well being placed first in report 1. Short (< 30 pages), non-technical (but rigorous) text 1. Emphasis on reproducibility ??? In 2016, we began taking steps to address these common critiques of the ESR model --- ## State of the Ecosystem: Structure .pull-left[ ### 2020 Report 1. Summary 2 pager 1. Human dimensions 1. Protected species 1. Fish and invertebrates (managed and otherwise) 1. Habitat quality and ecosystem productivity ### 2021 Possibilities 1. Summary 2 pager + Page 1 summary bullets + Page 2 synthesis themes 1. Provisioning and cultural services indicators 1. Supporting and regulating services indicators ] .pull-right[ *Established ecosystem-scale objectives* <table class="table" style="font-size: 14px; margin-left: auto; margin-right: auto;"> <thead> <tr> <th style="text-align:left;font-weight: bold;"> Objective Categories </th> <th style="text-align:left;font-weight: bold;"> Indicators reported here </th> </tr> </thead> <tbody> <tr grouplength="4"><td colspan="2" style="border-bottom: 1px solid;"><strong>Provisioning/Cultural</strong></td></tr> <tr> <td style="text-align:left; padding-left: 2em;" indentlevel="1"> Seafood Production </td> <td style="text-align:left;"> Landings by feeding guild </td> </tr> <tr> <td style="text-align:left; padding-left: 2em;" indentlevel="1"> Profits </td> <td style="text-align:left;"> Revenue decomposed to price and volume </td> </tr> <tr> <td style="text-align:left; padding-left: 2em;" indentlevel="1"> Recreation </td> <td style="text-align:left;"> Days fished; recreational catch </td> </tr> <tr> <td style="text-align:left; padding-left: 2em;" indentlevel="1"> Social & Cultural </td> <td style="text-align:left;"> Commercial engagement trends </td> </tr> <tr grouplength="5"><td colspan="2" style="border-bottom: 1px solid;"><strong>Supporting/Regulating</strong></td></tr> <tr> <td style="text-align:left; padding-left: 2em;" indentlevel="1"> Stability </td> <td style="text-align:left;"> Diversity indices (fishery and species) </td> </tr> <tr> <td style="text-align:left; padding-left: 2em;" indentlevel="1"> Biomass </td> <td style="text-align:left;"> Biomass or abundance by feeding guild from surveys </td> </tr> <tr> <td style="text-align:left; padding-left: 2em;" indentlevel="1"> Productivity </td> <td style="text-align:left;"> Condition and recruitment of managed species, Primary productivity </td> </tr> <tr> <td style="text-align:left; padding-left: 2em;" indentlevel="1"> Trophic structure </td> <td style="text-align:left;"> Relative biomass of feeding guilds, Zooplankton </td> </tr> <tr> <td style="text-align:left; padding-left: 2em;" indentlevel="1"> Habitat </td> <td style="text-align:left;"> Estuarine and offshore habitat conditions </td> </tr> </tbody> </table> ] --- ## Proposed ecosystem synthesis themes for 2021 Characterizing ecosystem change for fishery management: plain language summary for 2 pager * Multiple drivers of abundance, defined by the competing factors that influence the amount of fish in the ocean; * Regime shifts, or ecosystem change can happen rapidly as multiple drivers change; and, * Reorganization of the ecosystem, multiple factors that interact that change the structure and organization of the ecosystem, e.g. Tropicalization ## Synthetic analysis in progress: environment - fish condition - market price linkages 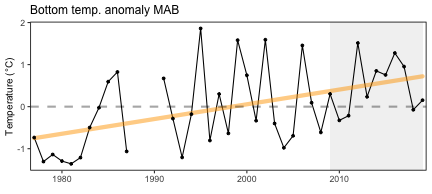 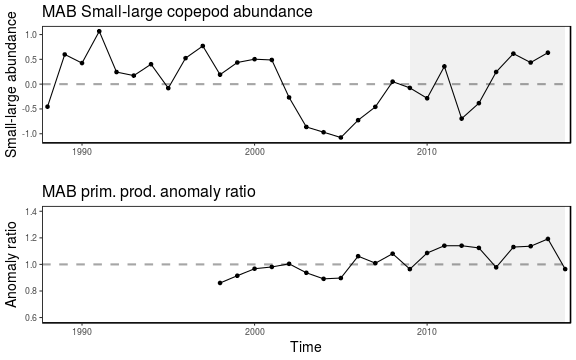 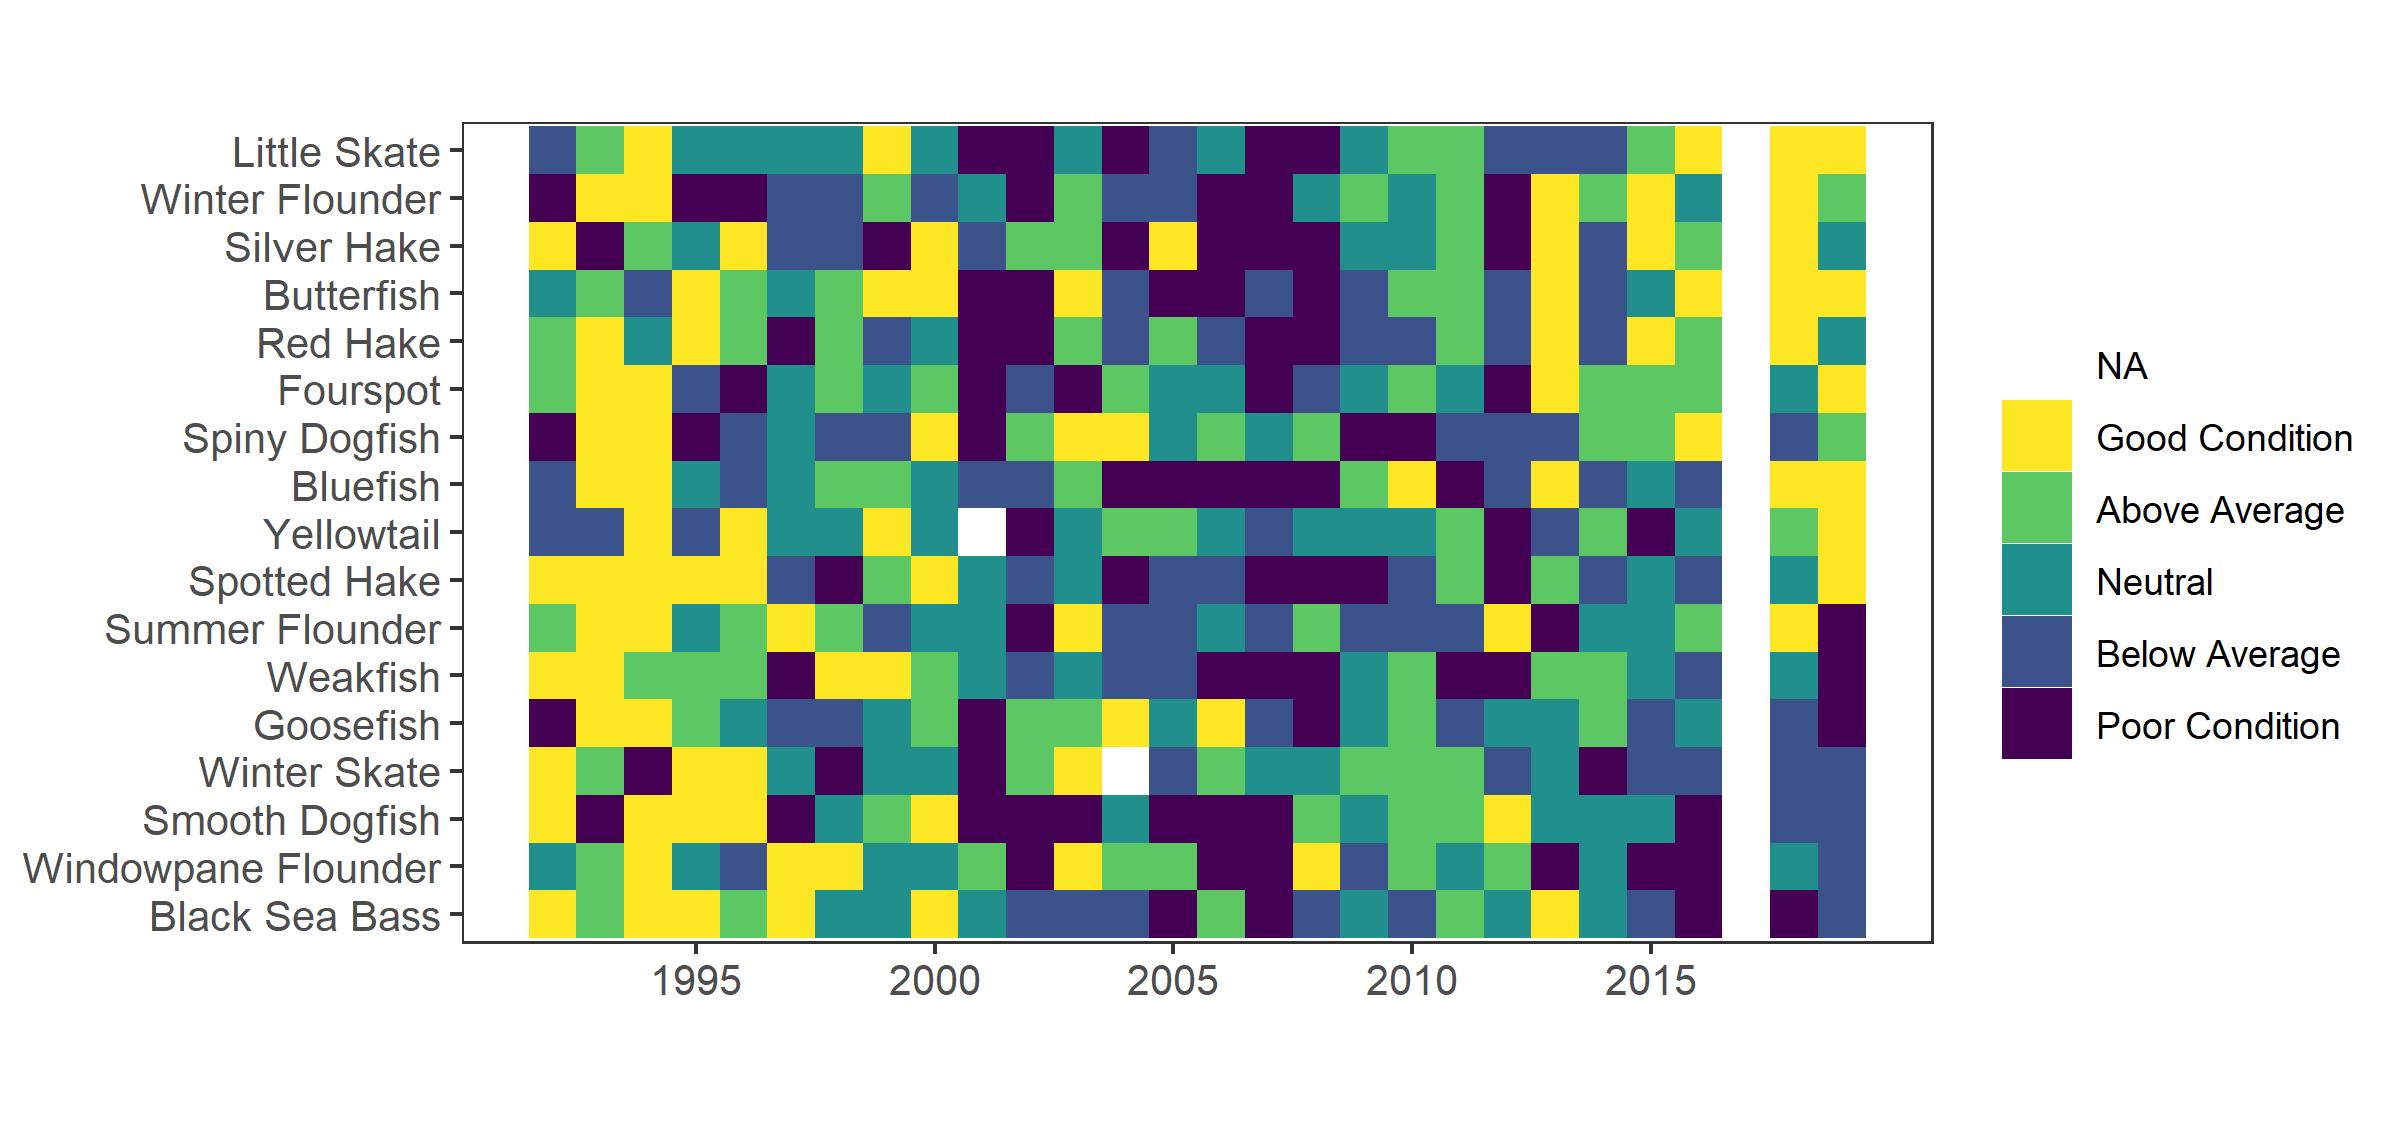  * Identify multiple and changing drivers of condition and market prices over time * Recognize regime shifts and potential system reorganization --- ## Memo 1-2: 2020 Summary 2 pager with visualizations; 2021 visualize synthesis themes, example? .pull-left[ .center[  ] ] .pull-right[ .center[  ] ] --- ## Memo 5: Synthesis analysis refinements for SSC and Council decisions? .pull-left[  ] .pull-right[  ] Conceptual model links indicators in the report with management objectives. A subset of objectives are currently under investigation using GAMs and hedonic price functions. We plan to extend this work with structural equation modeling and or other methods in 2020. --- ## Memo 28: Ecosystem Risk Score; how would the SSC use this? Add to EAFM Risk Assessment? Options from the literature, or combine existing indicators? .center[  ] .pull-left[ .center[  ] ] .pull-right[ <div class="figure"> <img src="20200909_MAFMC_SSC_Gaichas_files/figure-html/mab-heatwave-max-1.png" alt="Maximum intensity heatwave anomaly in the Mid-Atlantic Bight occurring on July 22, 2019." width="80%" /> <p class="caption">Maximum intensity heatwave anomaly in the Mid-Atlantic Bight occurring on July 22, 2019.</p> </div> ] --- ## Memo 29: Thresholds and Inflection Points; How would the SSC use these? Individual indicators or using many indicators at once? Single indicator example: .center[  ] ## National IEA Human Dimensions working group developing thresholds/rankings for social outcomes ## Lots of academic work on this: what is a useful starting point? .contrib[ Large, S. I., Fay, G., Friedland, K. D., and Link, J. S. 2013. Defining trends and thresholds in responses of ecological indicators to fishing and environmental pressures. ICES Journal of Marine Science, 70: 755–767. Large, S. I., Fay, G., Friedland, K. D., and Link, J. S. 2015. Quantifying Patterns of Change in Marine Ecosystem Response to Multiple Pressures: e0119922. PLoS One, 10. http://search.proquest.com/docview/1664222461/abstract/120C1207C54548BEPQ/1. Samhouri, J. F., Andrews, K. S., Fay, G., Harvey, C. J., Hazen, E. L., Hennessey, S. M., Holsman, K., et al. 2017. Defining ecosystem thresholds for human activities and environmental pressures in the California Current. Ecosphere, 8: e01860. Tam, J. C., Link, J. S., Large, S. I., Andrews, K., Friedland, K. D., Gove, J., Hazen, E., et al. 2017. Comparing Apples to Oranges: Common Trends and Thresholds in Anthropogenic and Environmental Pressures across Multiple Marine Ecosystems. Frontiers in Marine Science, 4. Frontiers. https://www.frontiersin.org/articles/10.3389/fmars.2017.00282/full. ] --- background-image: url("EDAB_images/scenario_4.png") background-size: 500px background-position: right ## SSC Discussion Points .pull-left-60[ + SSC or Council decisions where SOE report could help + Within or outside EAFM process + Which information supports which decisions? + What other information is needed? + Synthesis themes and management connections + General themes + Concrete worked example analysis (environment-condition-prices) + Ecosystem risk score + Thresholds and inflection points + Other suggestions for 2021+ ] .pull-right-40[ .center[ .footnote[ https://xkcd.com/2289/ ] ] ] --- ## External Resources * [SOE Technical Documentation](https://noaa-edab.github.io/tech-doc) * [ecodata R package](https://github.com/noaa-edab/ecodata) * [Macrofauna indicators](http://noaa-edab.github.io/ecodata/macrofauna) * [Human Dimensions indicators](http://noaa-edab.github.io/ecodata/human_dimensions) * [Lower trophic level indicators](http://noaa-edab.github.io/ecodata/LTL) * [ERDDAP server](https://comet.nefsc.noaa.gov/erddap/index.html) * Slides available at https://noaa-edab.github.io/presentations/ --- class: inverse background-image: url("EDAB_images/IMG_2809.jpg") background-size: cover ## Thank you! .pull-left[ Contacts: ] .pull-right[ <sarah.gaichas@noaa.gov>, <geret.depiper@noaa.gov> ]